Vertical grids
It is intended that the next generation of CAM will have enhanced vertical resolution and a higher model top (although not as high as its high-top counterpart WACCM). AMWG researchers are currently testing new vertical grids for CAM to achieve a balance between model fidelity and computational cost. There are many motivations to enhance the vertical resolution of CAM such as incorporation of a well represented stratosphere, which is thought to be important for predictability and the representation of various aspects of climate variability and change; improved representation of many features in the boundary layer such as clouds and vertical profiles of temperature and humidity; potential benefits of a more appropriate vertical resolution for higher horizontal resolution applications.
It is planned that there will be two new versions of CAM:
- One with a model lid height around 80km/0.01hPa
- The other with a model lid height that is similar to the current 32 level CAM at around 40km/3hPa
The 80km model will be the "workhorse" configuration used for applications like CMIP, while the 40km model provides a cheaper counterpart that can be used for applications such as tropospheric tuning or experiments where the stratosphere is not considered to be important.
Configuration and testing of this new vertical resolution is proceeding in two phases:
- Phase 1: Testing and configuration of free tropospheric and stratospheric grids for the 80km and 40km models
- Phase 2: Configuration of the new planetary boundary layer resolution within the grid chosen from phase 1
Results
- October 28, 2020: Phase 1 is well underway and phase 2 will begin in the near future. View results from Phase 1
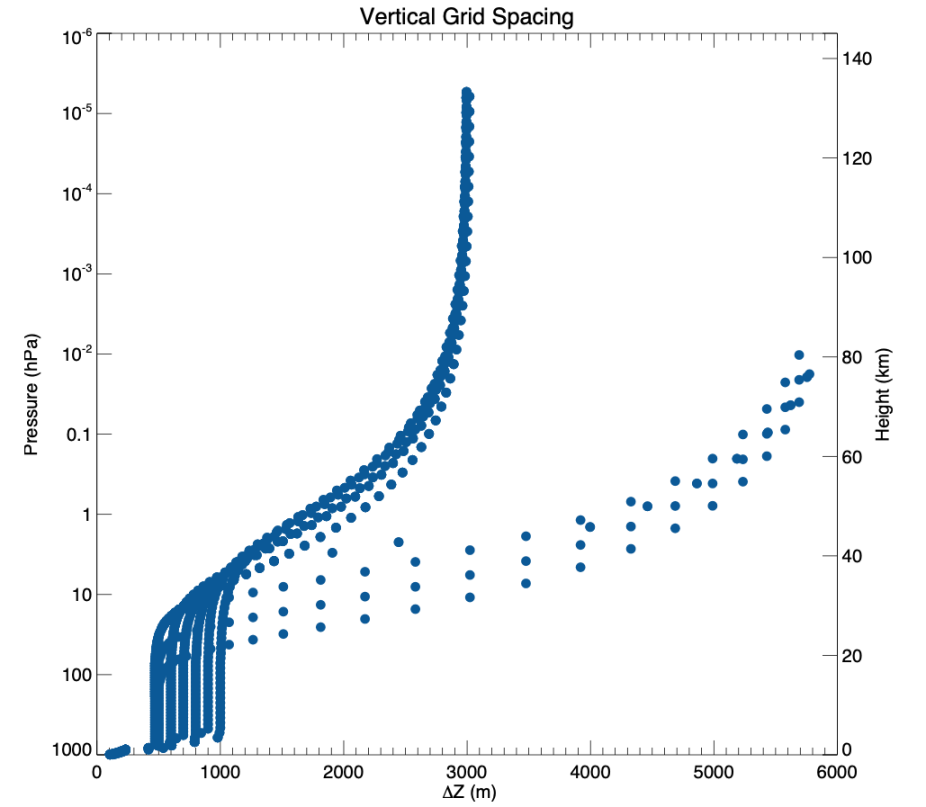
Figure: Vertical grid spacing (x axis) as a function of pressure/height in the model (y axis)
Vertical Grids Phase 1 Results
An extensive suite of tests were performed with various vertical grid spacing in the free troposphere and lower stratosphere (referred to as dz, hereafter) to examine the benefits gained by going to higher vertical resolution. Figure 1 provides a comparison of the vertical resolution in our current CAM and WACCM configurations (gray and black) with three potential grids for the new 80km “workhorse” configuration. Each of these new grids has a constant vertical resolution in the free troposphere and lower stratosphere and they range between a resolution in this region of dz=500 (brown) and dz=700 (green). The resolution is then degraded following a hyperbolic tangent profile to a model top at 80km. The overall resolution of each of these configurations is quoted in the legend with the “+10” referring to the fact that we expect to add an additional 10 levels into the boundary layer once Phase 2 is completed.
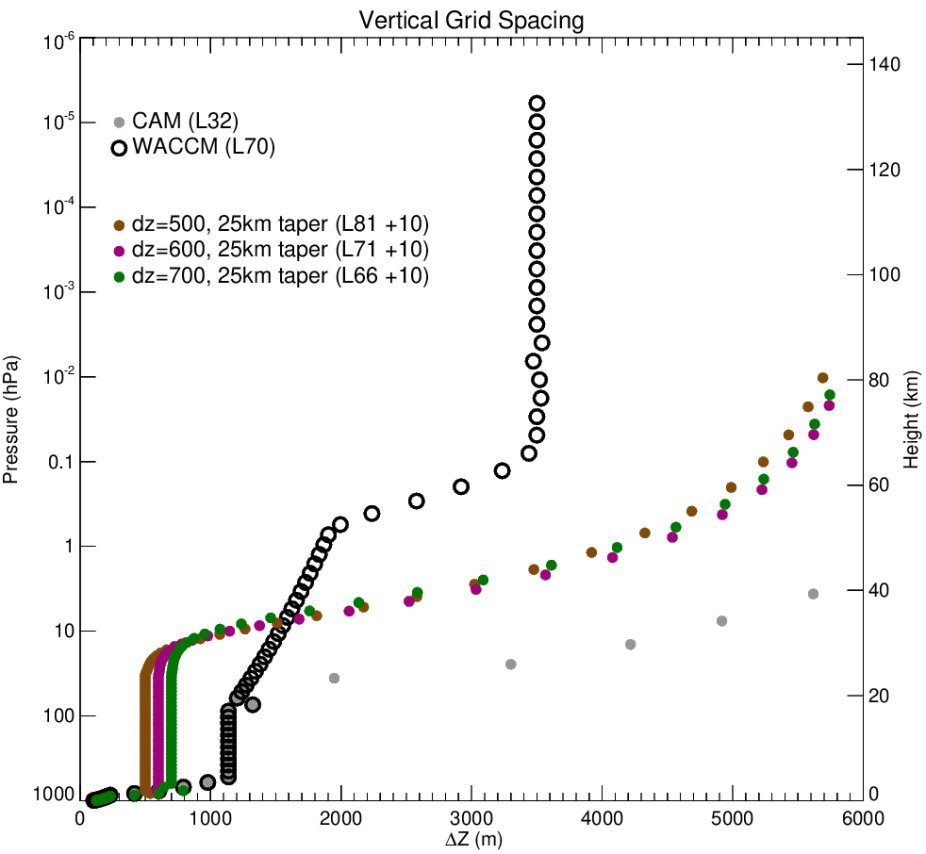
Figure 1: Vertical grid spacing (x axis) as a function of pressure/height in the model (y axis). Black open circles and gray circles show the current resolution for WACCM and CAM, respectively. The brown, pink and green points show three potential grids for the 80km “workhorse” model with dz=500, dz=600 and dz=700 in the free troposphere and lower stratosphere.
The results of Phase 1 indicated that we could successfully place the model top at 80km without substantial degradation in the climate below around 1hPa relative to WACCM. In addition, the enhanced free tropospheric and stratospheric resolution compared to current WACCM and CAM allows for a much improved simulation of the QBO (Figure 2). The QBO is one of the primary features that is sensitive to the free tropospheric and stratospheric resolution (dz). Tests with the finite volume dynamical core indicate that the optimum resolution for representing the amplitude of the QBO and the resolved wave driving in the lower stratosphere is dz=500. However, tests are currently underway to determine whether this holds true within the spectral-element dynamical core.
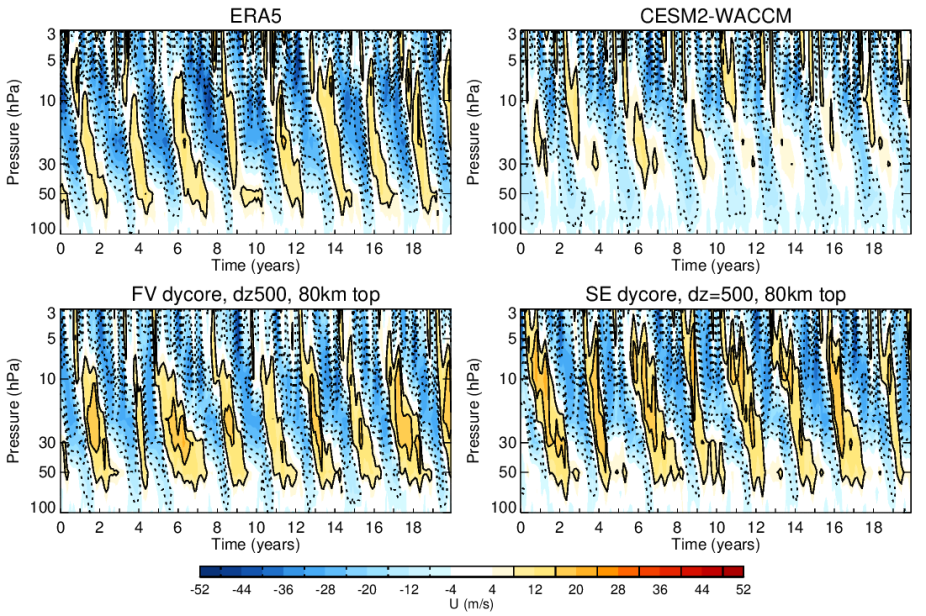
Figure 2: The representation of the QBO as given by time series of monthly mean zonal mean zonal wind averaged from 5S to 5N. (top left) ERA5 reanalysis, (top right) the current version of WACCM within CESM2 and (bottom) the potential new grid for the 80km model with dz=500 in (left) the finite volume dynamical core (same as CESM2-WACCM) and (right) the Spectral Element dynamical core.
A proposed grid for the low-top (40km) model with dz=500m is shown in Figure 3. Testing of the climate of this low-top configuration is currently under-way and it will soon be used to start testing new vertical grid configurations of the boundary layer in Phase 2.
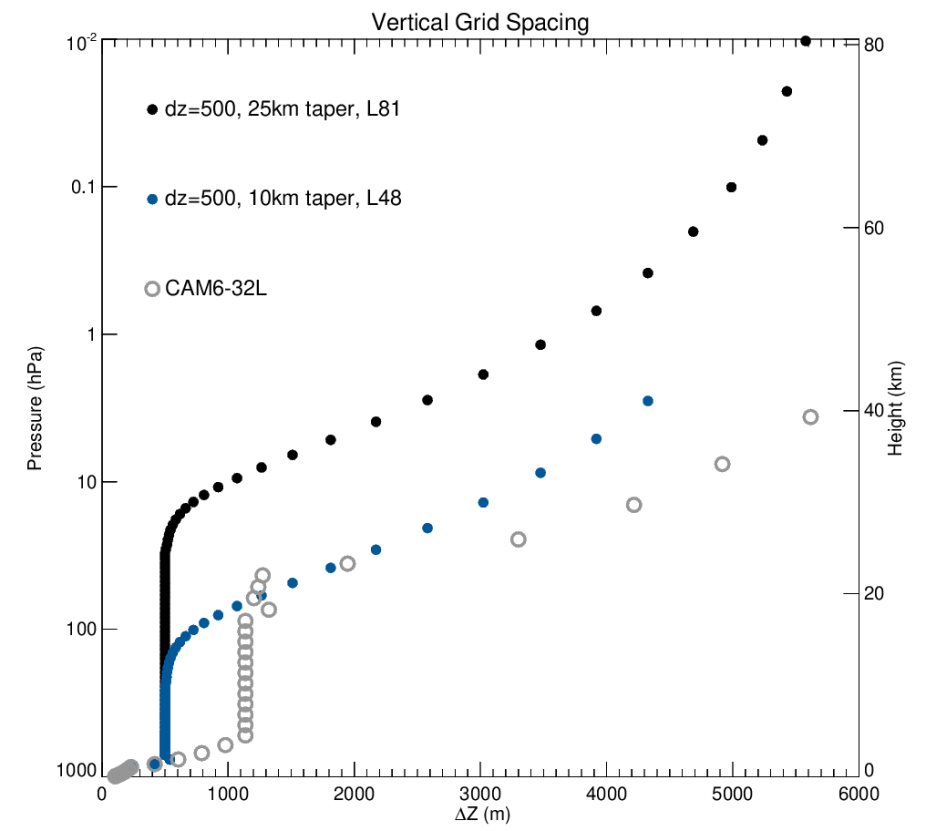
Figure 3: Vertical grid spacing (x-axis) as a function of pressure/height in the model (y axis). Gray shows the current resolution of CAM6 and black repeats the dz=500, 80km model from Figure 1. Blue now shows a proposed grid configuration for the 40km model. This has the same resolution as the 80km model in the troposphere but the degradation in resolution starts lower down and the model top is placed at around 40km.